Filter data
0. Load full dataset (optional)
Summarise data
Summary
Filter data
9. Filter data
10. Preview data
Location
Date
Depth
Data availability per citation
Data availability per site
Full variable names
PANGAEA
The data hosted on this portal are published on PANGAEA , where they may be downloaded in their entirety.
ESSD
For an in-depth analysis of these data, as well as the details on how they were collected, please see the paper currently in review at Earth Systems Science Data (ESSD) .
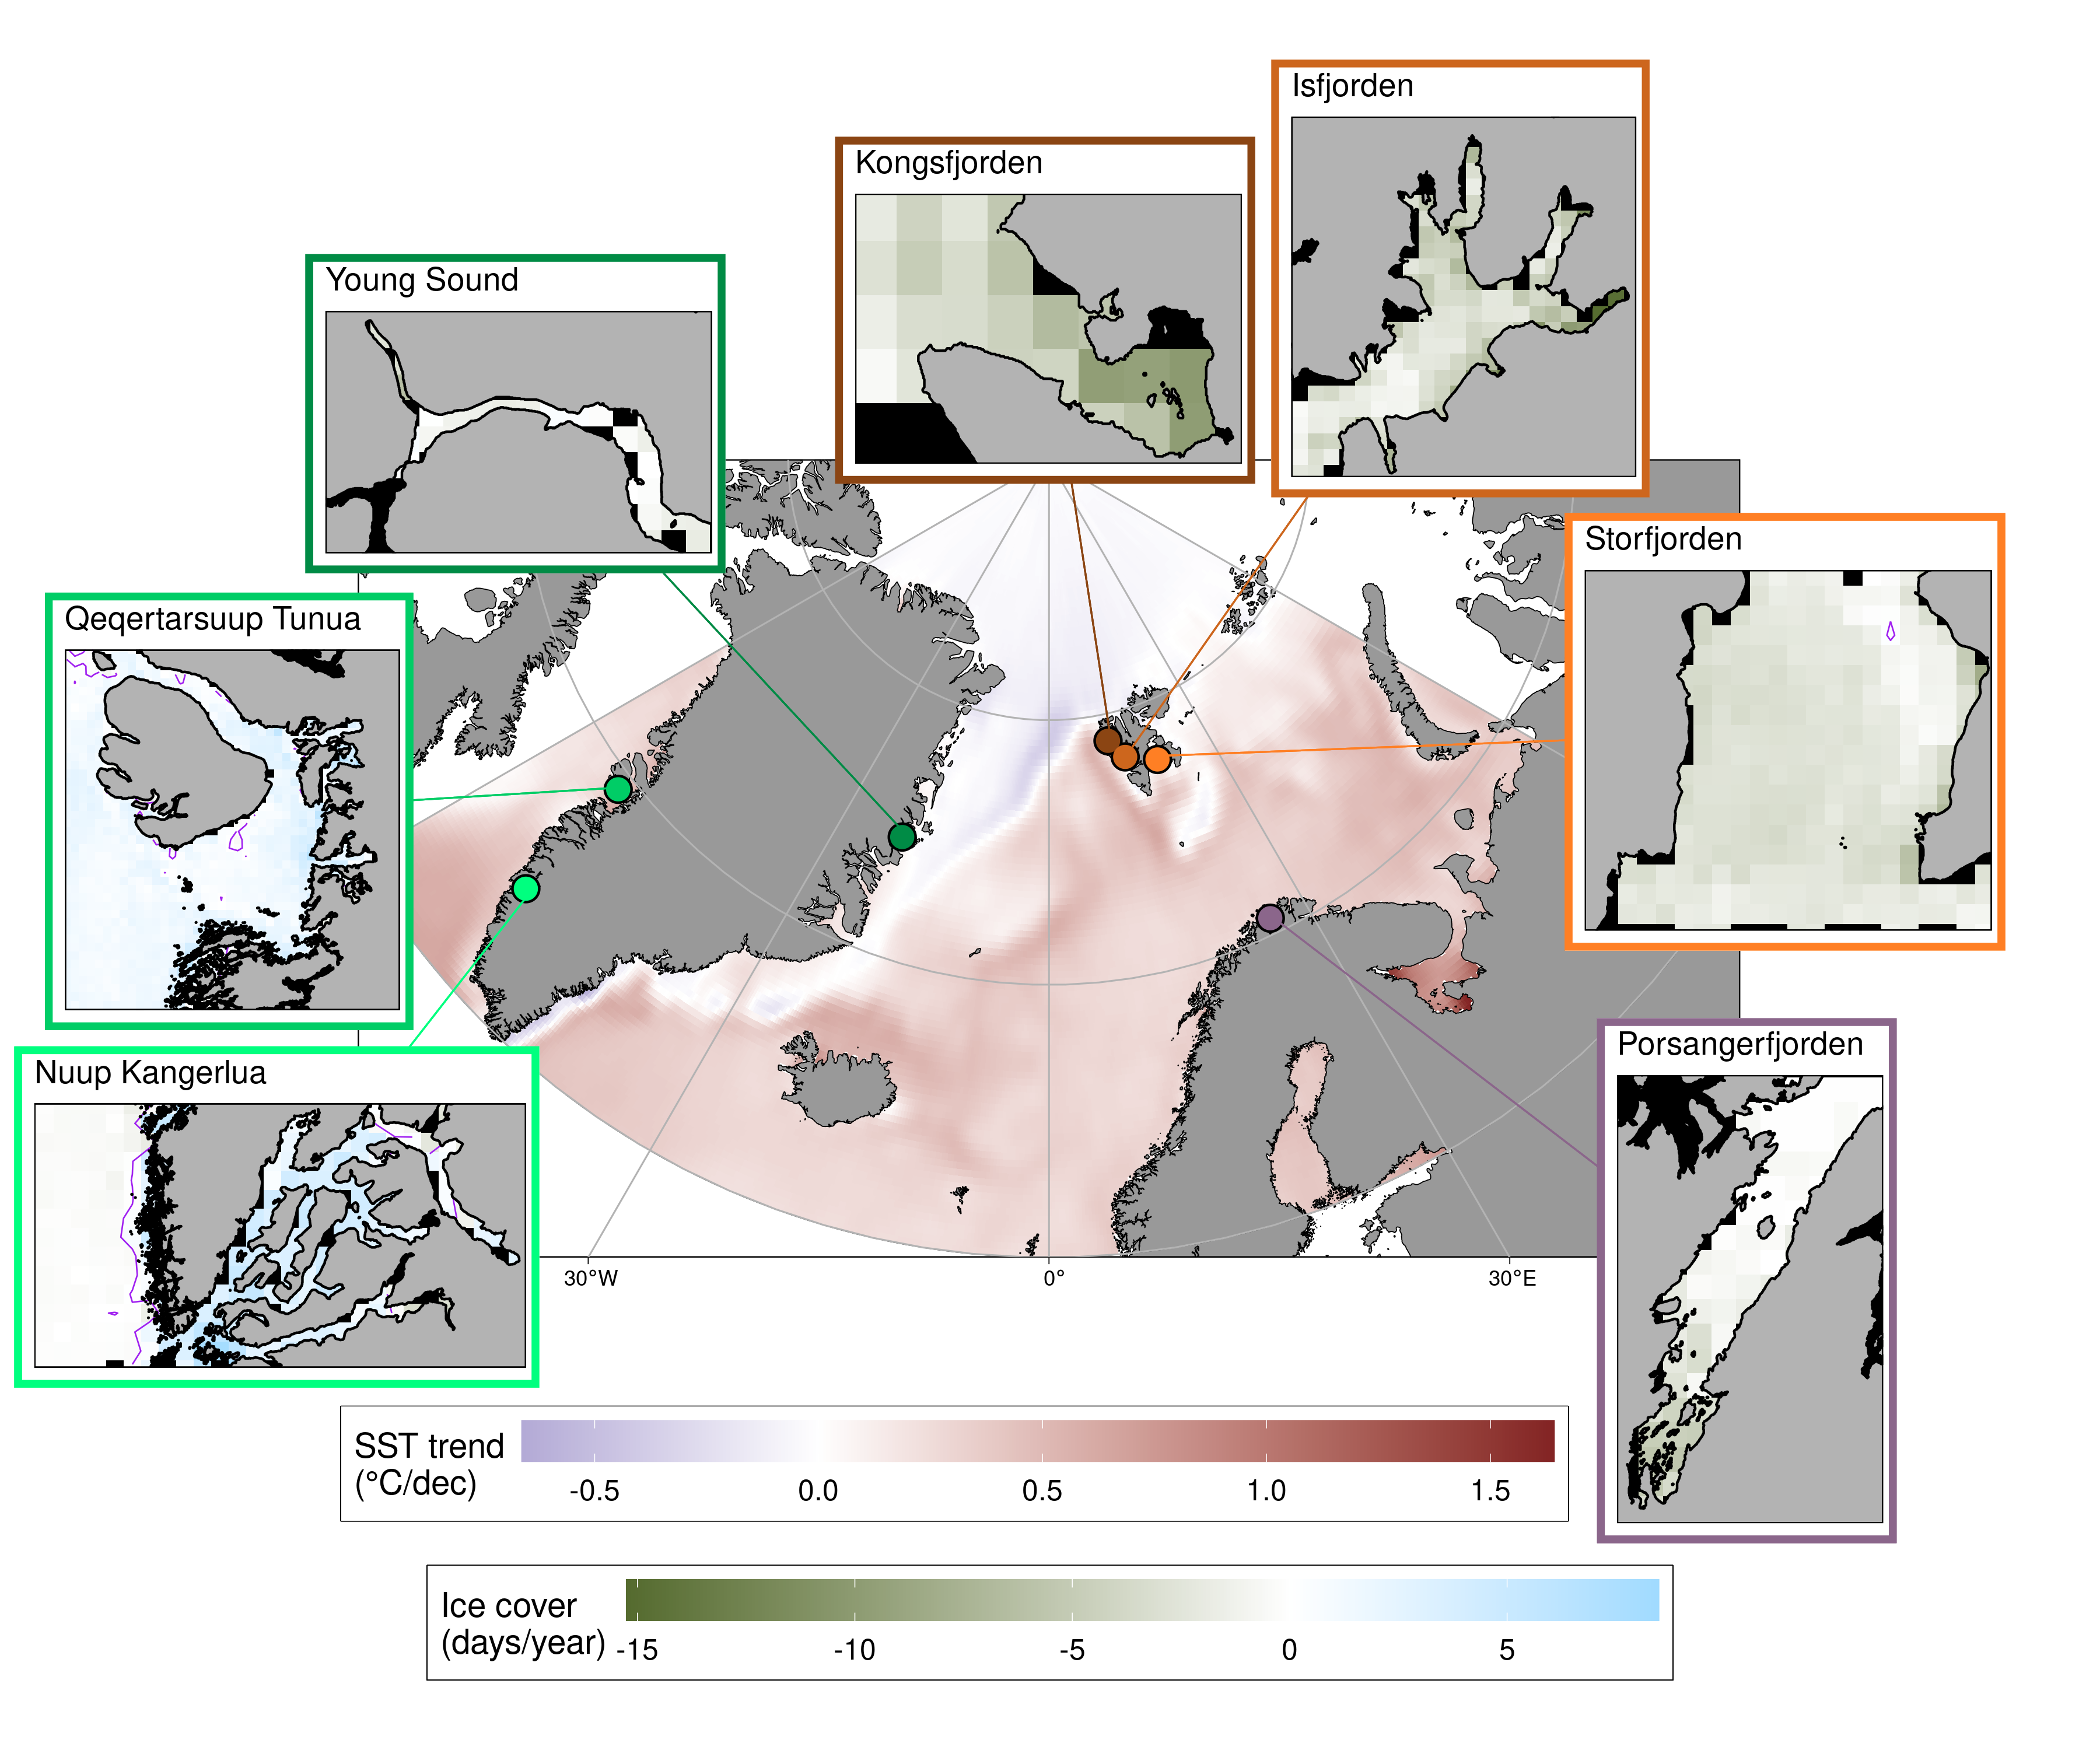
Figure 1 from ESSD paper. Map of the EU Arctic showing the decadal trends in sea surface temperature (SST). Pop-out windows for each of the seven FACE-IT study sites show the annual trend in sea-ice cover days.
Coastal futures
The rational for the data collected, and for how they are classified (e.g. categories + drivers) are detailed in a publication available at coastal futures .
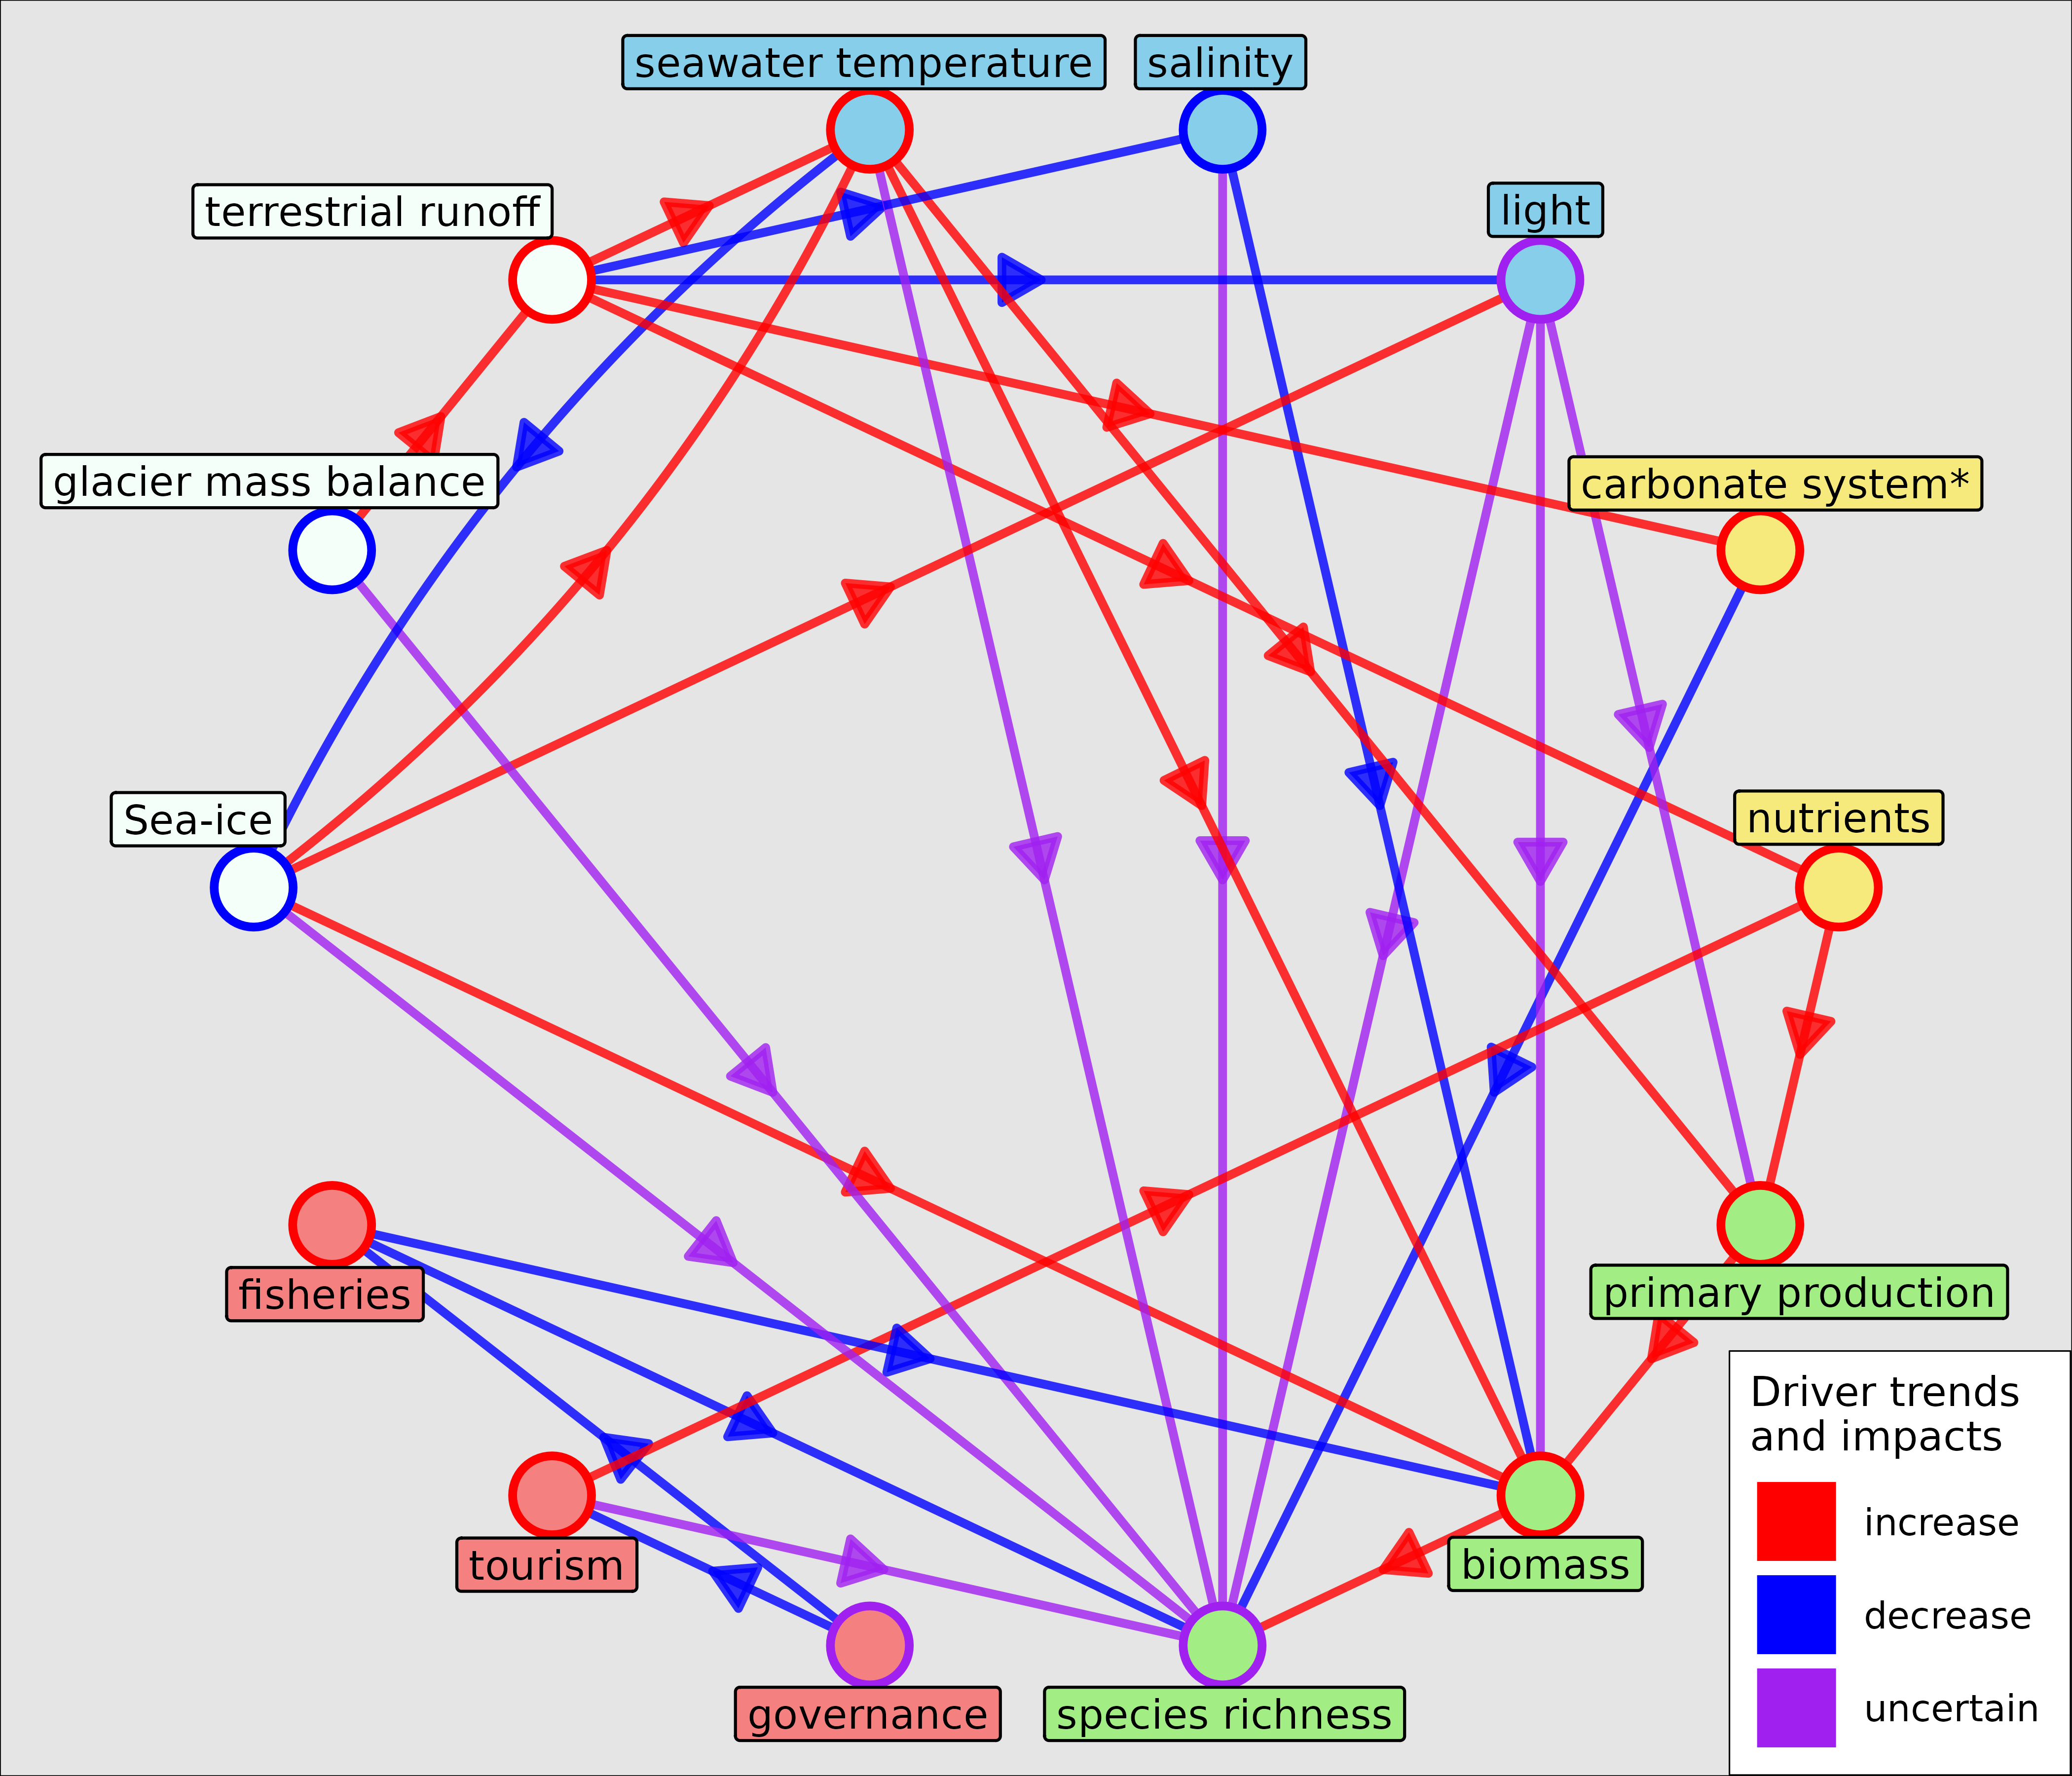
Figure 2 from Coastal Futures paper. A network plot showing the trends in the 14 key drivers of change in EU Arctic fjords and what effects they are having on each other.